Where you live shapes your health more than most people realize. We analyzed Neighborhood Wellness Scores across 13,401 U.S. ZIP codes — measuring food access, air quality, walkability, and healthcare availability — to find the single top-scoring ZIP code in all 50 states plus D.C. Some results will surprise you.
Where you live shapes your health more than most people realize. Research from the World Health Organization estimates that 30 to 55 percent of health outcome variance comes from social and environmental factors: The food within reach, the air quality outside your door, how walkable your streets are, and how accessible quality healthcare is.
Using our Neighborhood Wellness Score. which synthesizes food access, movement infrastructure, environmental quality, healthcare access, and health outcomes across 18,356 U.S. ZIP codes. We identified the single highest-scoring ZIP code in each state. These aren’t just the richest ZIPs. They’re the places where the full picture of daily-life health conditions aligns best.
Scores run from 0–100. A score of 80+ means the ZIP ranks in the top tier nationally. Every state’s winner earned it a different way. The link at the bottom of each card opens that ZIP code’s full report — water, air, food and health outcomes, block by block.
How to read the scores: Each ZIP is rated 0–100 across five dimensions. Health outcomes measures chronic disease rates and preventable hospitalizations. A top score means residents here have among the lowest chronic disease rates in the country. Food access reflects grocery density and proximity. Movement covers parks, bike lanes, and fitness facilities. Environment reflects air and water quality. We show air quality as a percentage below the federal safety limit (cleaner = higher % below). Healthcare access measures clinic presence and coverage rates.
🥦 FoodGrocery access and healthy-to-fast-food ratio
🏃 MovementParks, walkability, and fitness access
🌿 EnvironmentAir quality and water safety
❤️ HealthChronic disease and hospitalization rates
🏥 HealthcareClinic access and coverage rates
The Healthiest ZIP Code in Every State
The single highest-scoring ZIP code in all 50 states and Washington D.C., ranked by national percentile across food access, walkability, air quality, healthcare access, and health outcomes. Sorted alphabetically by state.
How this list is ordered: we count up — starting with the state whose winning ZIP had the toughest fight, and building to the perfect 100s. When states tie, the bigger state comes later. California closes the show.
The Worst of the Best
54/100
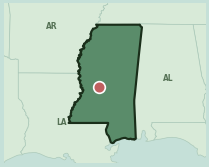
Mississippi
RidgelandZIP 39157
#8,365 healthiest ZIP code in America of 18,356
🥦 Food 90🏃 Movement 64🌿 Environment 75❤️ Health 76🏖️ Beach access💪 High gym density🏥 Healthcare 69
In a state where 10 of the lowest-scoring ZIPs in the dataset are located, Madison’s 39157 has some of the strongest food access in Mississippi. Context matters: it’s Kroger coverage reaching where specialty chains won’t operate. Practical access, not curated access. The 356 estimated annual corporate fast-food visits per resident is one of the highest figures among any state’s top ZIP; that’s the behavioral gap that good grocery access hasn’t yet closed.
→90/100 food access in one of America’s most food-challenged states. Built on Kroger density
→356 estimated annual fast-food visits per resident. One of the highest among all state-representative ZIPs in this list
→The defining edge: chronic disease and hospitalization rates here are measurably lower than the rest of Mississippi
One more thing about RidgelandWilliam Austin bought land beside the Natchez Trace here in 1832. The property passed to James Yellowley in 1853, and in 1896 two developers, Gorton Nichols and Edward Treakle, bought it, formed the Highland Colony Company and gave the place its present name. Ridgeland incorporated on 29 December 1899. For years after that it made its money on pears and strawberries, with a hotel, a sawmill and a canning company in town. The Natchez Trace Parkway still runs alongside it.Source: City of Ridgeland, Ridgeland History Trail
🥦 Food 78🏃 Movement 37🌿 Environment 80❤️ Health 60🐕 Dog park🌱 Community garden🏥 Healthcare 73
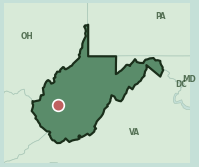
West Virginia ranks last in this list. And that number belongs in state context. Charleston’s 25314 is the best ZIP in a state that consistently occupies the bottom tier of national wellness rankings. Health outcomes here reflect structural challenges the ZIP didn’t create; movement options reflect car-dependent design. What it has: cleaner-than-average air and water, Kroger providing functional grocery access, and a 2.1:1 venue ratio that edges toward health-positive.
→80/100 environment. The strongest sub-score here, and above the national median
→66/100 composite is the lowest in this list. But the highest in West Virginia, where every point matters
→The defining edge: chronic disease and hospitalization rates here are measurably lower than the rest of West Virginia
🥦 Food 93🏃 Movement 73🌿 Environment 54❤️ Health 77💪 High gym density🏥 Healthcare 91
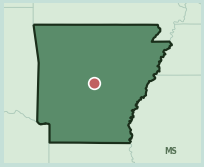
Both Whole Foods and Trader Joe’s share this Little Rock ZIP. In a market that doesn’t typically attract multiple specialty grocers, that dual presence is why healthy food is so accessible here. The edge of healthy food options over fast food here is thinner than most top performers, and fast-food visit counts are high. But the grocery quality floor holds in a region where food access usually drags everything else down.
→Dual specialty grocer coverage (Whole Foods + Trader Joe’s). Rare outside top-20 metro areas
→93/100 food access in a Southern state where the median ZIP scores around 65
→The defining edge: chronic disease and hospitalization rates here are measurably lower than the rest of Arkansas
One more thing about Little RockOn 9 April 1722 the French explorer Jean-Baptiste Benard de la Harpe came up the Arkansas River and noted the first rock outcrop he had seen since leaving New Orleans. He called it la petite roche, the little rock, to tell it apart from the much larger bluff across the water. The city took the name of the smaller one. A 4,700-pound piece of that outcrop was hauled up to City Hall in 1932 and returned to the riverfront in 2010.Source: City of Little Rock / Arkansas Historic Preservation Program
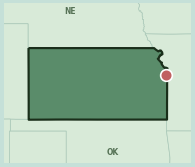
🥦 Food 92🏃 Movement 64🌿 Environment 69❤️ Health 97🐕 Dog park💪 High gym density🏥 Healthcare 82
Overland Park’s 66223 posts some of the lowest chronic disease rates in Kansas despite middling options for staying active day-to-day, which points to how much weight the food side is carrying. Sprouts as the market anchor brings excellent grocery access to a state where that’s rare, and the health numbers respond: Kansas’ top ZIP holds below the state baseline on every chronic condition even where gym density and walkability lag.
→Diabetes and preventable hospitalization rates rank among the lowest in Kansas. The food environment is doing the heavy lifting
→Sprouts as the specialty food anchor in a market that typically runs conventional grocery only
→The defining edge: grocery density and healthy venue ratio both among the highest in Kansas
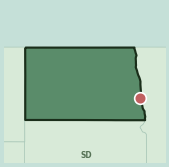
🥦 Food 62🏃 Movement 63🌿 Environment 85❤️ Health 80🚲 Bike share💪 High gym density🏥 Healthcare 85
North Dakota’s healthiest ZIP code shows both strengths and honest limitations of Plains living. Food and activity options reflect real gaps you’d expect in this market. What 58103 has going for it is cleaner-than-average air and water typical of the Great Plains, 14.5 walkability that outperforms most mid-sized Midwest cities, and bike share access most comparable areas don’t have. Jewel-Osco covers groceries where specialty options don’t reach.
→85/100 environment score. The ZIP’s strongest sub-score, reflecting Great Plains air and water quality
→14.5 walkability for a Plains city. Above average for the market type
→The defining edge: clinic density and preventive care options above most of North Dakota
One more thing about FargoSettlers staked out Fargo in 1871 at the point where the Northern Pacific Railroad would cross the Red River, and the town took its name from William G. Fargo, a director of that railroad who had co-founded Wells Fargo. On 7 June 1893 a fire started on Front Street and a south wind carried it through the middle of town. More than 31 blocks burned. Fargo put up 246 new buildings inside a year, and plenty of them are still standing.Source: City of Fargo, City History
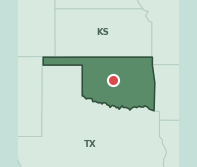
🥦 Food 87🏃 Movement 89🌿 Environment 57❤️ Health 82🏥 Healthcare 90
Oklahoma is a hard state to score well in. The median ZIP here lands at 19 out of 100 on health outcomes, against a national median of 52. This pocket of northwest Oklahoma City reads 82. Grocery access, movement infrastructure and healthcare access all sit near 90, roughly double the state median on each. Air quality is the one place it gives ground.
→Health outcomes score of 82 against an Oklahoma median of 19. The widest gap between a state winner and its state on this list
→Movement 89 and healthcare access 90 — close to double the state medians of 47 and 51
→Working against it: environment scores 57, below the Oklahoma median of 69. The one measure where the rest of the state does better
One more thing about Oklahoma CityZIP 73116 contains Nichols Hills, which exists because of a stunt. In the fall of 1928 the developer G. A. Nichols put up ten clapboard shacks on his land north of the city and had ten business partners sleep in them overnight. The next morning they could swear they were legal residents, and they petitioned to incorporate. The town was approved in 1929. Nichols had the streets curved on purpose, so drivers would slow down and look at his houses.Source: Oklahoma Historical Society, Encyclopedia of Oklahoma History and Culture
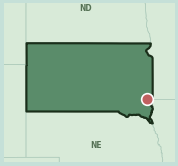
🥦 Food 68🏃 Movement 63🌿 Environment 94❤️ Health 82🐕 Dog park💪 High gym density🏥 Healthcare 87
Clean Great Plains air and 531 estimated annual corporate fast-food visits per resident. Sioux Falls’ 57105 carries both at once. The air quality is real; the consumption pattern is also real, reflected in moderate food access scores. Hy-Vee provides the best full-service grocery coverage in the market, and 13.4 walkability is strong for a Plains city, but there’s a clear gap between what the landscape offers and what residents are choosing.
→94/100 environment score. Among the cleanest air and water in the Midwest
→531 estimated annual fast-food visits per resident. One of the highest figures in the full dataset
→The defining edge: clinic density and preventive care options above most of South Dakota
One more thing about Sioux FallsSouth Dakota once asked only ninety days of residency before you could file for divorce, a leftover from frontier life that most states did not allow. From 1891 Sioux Falls was where people came to use it, and the newspapers named them the divorce colony. Six rail lines met here. The Cataract House put visitors up at three dollars a day, and one building downtown held 38 law firms. Nevada took the business away in 1931.Source: The Washington Post / South Dakota Public Broadcasting
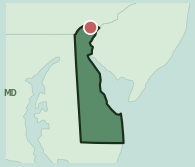
🥦 Food 90🏃 Movement 80🌿 Environment 22❤️ Health 91🥾 Trail access🐕 Dog park🏥 Healthcare 84
Real air quality challenges sitting next to excellent food options and some of the lowest chronic disease rates in the state. Delaware’s top ZIP has the clearest contradiction in the Northeast. Industrial air and water pressure drags the overall picture down, while food access and health outcomes hold it up. An ALDI within 19803 is what makes the food access possible: this is affordable grocery access doing measurable work, not an affluent-neighborhood story.
→22/100 environment score. Industrial air/water exposure, not a reflection of the food or health picture
→ALDI as the food anchor: 90/100 food access built on affordability rather than premium chain presence
→The defining edge: chronic disease and hospitalization rates here are measurably lower than the rest of Delaware
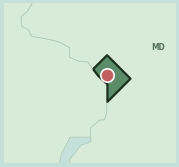
🥦 Food 94🏃 Movement 94🌿 Environment 66❤️ Health 100🚲 Bike share🐕 Dog park⛵ Marina access🏥 Healthcare 97
Dupont Circle’s 20036 ranks as the second-healthiest ZIP code in this list, and the foundation is remarkable health outcomes. Modeled chronic disease rates lower than almost any ZIP in the country. With equally solid food access and daily movement, this neighborhood doesn’t rely on one standout category; it’s the consistency across every dimension that makes it work.
→Physical inactivity rate of 8%. residents here are 43% more likely to stay active than the state average of 15%
→94/100 on both food access and movement in the same ZIP. Paired sub-score strength uncommon nationally
→The defining edge: grocery density and healthy venue ratio both among the highest in Washington D.C.
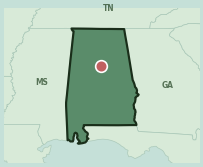
🥦 Food 95🏃 Movement 71🌿 Environment 54❤️ Health 92🐕 Dog park🌱 Community garden🏥 Healthcare 92
Food access across most of Alabama is limited. Cahaba Heights is a different story. Cahaba Heights’ grocery options, anchored by a Whole Foods, plenty of nearby stores, and roughly 3 health-supporting food options for every fast food outlet, help drive some of the lowest chronic disease rates in the state. In a region where that gap is genuinely hard to create.
→About 76% of nearby food venues are health-supporting. Above average for a Southern market
→Physical inactivity rate of 17%. residents here are 45% more likely to stay active than the state average of 31%
→The defining edge: chronic disease and hospitalization rates here are measurably lower than the rest of Alabama
One more thing about BirminghamThe neighborhood here takes its name from the Cahaba River, which at 190 miles is the longest free-flowing river left in Alabama. Biologists have counted 131 fish species in it, more than any river its size in North America, and eighteen of those live nowhere else on earth. For about five weeks starting in mid-May the Cahaba lily blooms in the shoals. The largest known stand of them sits downstream in a federal refuge in Bibb County.Source: U.S. Fish and Wildlife Service, Cahaba River National Wildlife Refuge
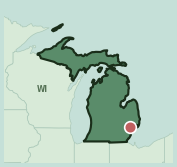
🥦 Food 95🏃 Movement 63🌿 Environment 66❤️ Health 97🏖️ Beach access🌱 Community garden🐕 Dog park🏥 Healthcare 83
Food access and health outcomes in Birmingham rank among the strongest in Michigan. And that alignment matters. Movement options are more modest here, which means the food environment is doing the heavier lifting. A beach and community garden provide outdoor engagement where gym options are lighter; the 3.5:1 venue ratio ensures the food landscape tilts toward whole foods rather than competing against them.
→Physical inactivity rate of 14%. residents here are 47% more likely to stay active than the state average of 26%
→Beach and community garden as primary outdoor anchors. Movement is environment-driven, not facility-driven
→The defining edge: chronic disease and hospitalization rates here are measurably lower than the rest of Michigan
🥦 Food 90🏃 Movement 62🌿 Environment 77❤️ Health 78🏥 Healthcare 89
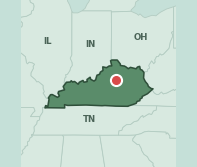
Lexington’s inner suburbs carry Kentucky. Health outcomes read 78 in a state whose median ZIP sits at 33 — a 45-point gap. Food and healthcare access are both strong, which in Kentucky is genuinely uncommon. It wins on the strength of a university town rather than on anything the wider state offers.
→Health outcomes 78 against a Kentucky median of 33
→Food and healthcare access both well clear of the state median
→Worth knowing: Kentucky’s winner ranks #1,872 nationally — the state’s best is a long way from the country’s best
One more thing about LexingtonHenry Clay arrived from Virginia in 1797 and began buying land outside the city limits in 1804. His estate, Ashland, grew to 672 acres of hemp, tobacco and grain. Seventeen of those acres survive at 120 Sycamore Road, a National Historic Landmark run as a house museum by the Henry Clay Memorial Foundation since 1950. The rest of the plantation was subdivided into the neighborhood that still carries the name, and that neighborhood is this ZIP code.Source: Henry Clay Memorial Foundation / National Trust for Historic Preservation
Not As Good As You Think You Are (Yes, You, Oregon)
91/100
Missouri
Saint LouisZIP 63131
#1,704 healthiest ZIP code in America of 18,356
🥦 Food 92🏃 Movement 76🌿 Environment 75❤️ Health 95🥾 Trail access🐕 Dog park🏥 Healthcare 88
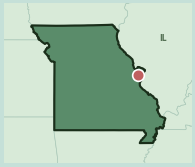
Trader Joe’s in one of Missouri’s strongest food environments, trail access within reach, and some of the lowest chronic disease rates in the state. Des Peres’ 63131 takes the top spot not because of a single standout, but through consistent strength across food, activity, and health. At 9.2 walkability and 131 estimated annual fast-food visits per resident, the ZIP leans health-forward without the full density of a bigger city pushing it even further.
→Physical inactivity rate of 18%. residents here are 44% more likely to stay active than the state average of 32%
→Trader Joe’s in a St. Louis suburb. Specialty grocery access that’s not standard at this market density
→The defining edge: chronic disease and hospitalization rates here are measurably lower than the rest of Missouri
🥦 Food 98🏃 Movement 94🌿 Environment 92❤️ Health 82🚲 Bike share🌱 Community garden🏖️ Beach access🏥 Healthcare 96
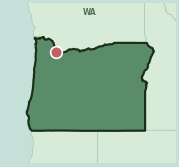
Portland’s Boise District has one of the strongest food environments of any ZIP code west of the Mississippi. What makes this neighborhood stand out is that food options, daily activity, and environmental quality are all excellent at the same time. That combination is genuinely rare across US neighborhoods. At 17.3 walkability and with air quality about 40% below the federal limit, the environmental quality here reaches the high end of what American urban areas can achieve.
→98/100 food access. Highest of any state-representative ZIP west of the Mississippi
→The defining edge: grocery density and healthy venue ratio both among the highest in Oregon
One more thing about PortlandShipyard work pushed Portland’s Black population from 1,931 in 1940 to more than 20,000 by 1945, most of them housed at Vanport. The Columbia River flood of May 1948 destroyed Vanport and displaced over 16,000 people, and restrictive covenants across east Portland left Albina as one of the few districts where they could buy. By 1960 roughly 80 percent of the city’s Black residents lived in Albina’s 4.2 square miles. Memorial Coliseum and Interstate 5 then cut through it.Source: BlackPast.org / The Oregon Encyclopedia
🥦 Food 90🏃 Movement 86🌿 Environment 55❤️ Health 91🌱 Community garden⛵ Marina access🐕 Dog park🏥 Healthcare 79
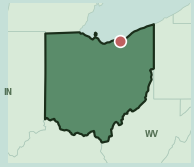
Rocky River’s 44116 doesn’t have one standout strength. But having solid food access, easy ways to stay active, and some of the state’s lowest chronic disease rates all at once happens in fewer than 15 Ohio ZIPs. A marina and community garden serve as the main outdoor anchors, reflecting a Lake Erie waterfront neighborhood where nature-based movement is built into daily life rather than something you have to plan; a Whole Foods nearby keeps healthy food options strong.
→Three sub-scores above 85 simultaneously (food, movement, health outcomes). Uncommon in Ohio
→Marina and community garden as primary anchors. Movement opportunity built into the geography
→The defining edge: chronic disease and hospitalization rates here are measurably lower than the rest of Ohio
🥦 Food 97🏃 Movement 43🌿 Environment 98❤️ Health 86🥾 Trail access🌳 Parks nearby🏥 Healthcare 62
Fourteen health-positive venues for every fast-food option. That ratio isn’t built on health-chain density. It reflects how few corporate outlets have penetrated Girdwood at all. Pair that with some of the cleanest air and most protected wilderness of any ZIP code we’ve scored, and the overall picture holds up well even where getting around on foot or by bike isn’t always practical.
→About 93% of nearby food venues are health-supporting. Fast food has almost no foothold here
→97.5/100 environment score. One of the highest readings in the full dataset of 22,000+ ZIPs
→The defining edge: grocery density and healthy venue ratio both among the highest in Alaska
One more thing about GirdwoodThe town was called Glacier City before it took the name of James Girdwood, a Belfast linen merchant who staked the first four gold claims on Crow Creek in 1896. The mines closed in the late 1930s and the place nearly emptied. Then the magnitude 9.2 earthquake on Good Friday 1964 dropped the ground along Turnagain Arm by eight to ten feet, leaving the townsite below the high-tide line. Girdwood was rebuilt two and a half miles up Glacier Creek.Source: Municipality of Anchorage, Girdwood Area Plan
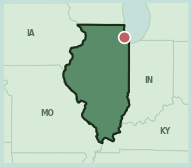
🥦 Food 97🏃 Movement 75🌿 Environment 55❤️ Health 99🚲 Bike share🥾 Trail access🌱 Community garden🏥 Healthcare 96
Oak Park’s walkability score of 17.9 puts it among the most walkable neighborhoods in the country. The area has some of the lowest chronic disease rates in Illinois, paired with excellent grocery access, and these don’t just coexist with that walkability. They’re produced by it. When food options are high quality and walking is structurally easy, better health tends to follow.
→17.9 walkability. One of the highest readings in the Midwest
→Having both food access and health outcomes above 95 simultaneously is a threshold fewer than 1% of ZIP codes nationally clear
→The defining edge: grocery density and healthy venue ratio both among the highest in Illinois
Getting Better, But Still Not Great (We’re Talking to You, Texas)
94/100
Montana
MissoulaZIP 59804
#1,002 healthiest ZIP code in America of 18,356
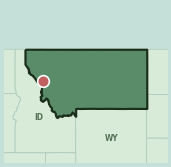
🥦 Food 95🏃 Movement 41🌿 Environment 72❤️ Health 86🏥 Healthcare 71
Nearly eight health-supporting venues for every fast-food outlet. That ratio isn’t produced by chain health density. It reflects a food culture, built around Natural Grocers and independent options, that keeps corporate fast food structurally outnumbered. The result is some of the best food access in Montana and one of the strongest in the Mountain West.
→About 89% of food venues nearby are health-supporting. Exceptional for a city of Missoula’s size
→95/100 food access in Montana. Highest in the state, driven by Natural Grocers and independent food culture
→The defining edge: grocery density and healthy venue ratio both among the highest in Montana
One more thing about MissoulaOn 14 June 1897 twenty-three men rode out of Fort Missoula on bicycles, bound for St. Louis. Twenty were Black soldiers of the 25th Infantry, one of the Army’s segregated regiments, and the Army wanted to know whether troops could be moved by bicycle. They covered 1,900 miles in 41 days, 35 of them riding, averaging about six miles an hour over railroad grades and mud. The fort they left from still stands in this ZIP code.Source: Smithsonian Magazine / Montana Memory Project
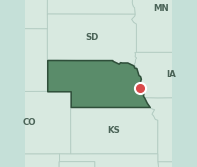
🥦 Food 54🏃 Movement 66🌿 Environment 66❤️ Health 97🏥 Healthcare 83
West Omaha carries Nebraska on health outcomes — 97 against a state median of 76. Healthcare access is 83, walkability 66, both comfortably clear of the state. Environment is the drag at 66, under Nebraska’s median of 75, and food access at 55 is good rather than remarkable.
→Health outcomes 97 against a Nebraska median of 76
→Healthcare access 83 and walkability 66, both well clear of the state medians of 56 and 43
→Working against it: environment 66, below Nebraska’s median of 75
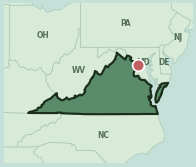
🥦 Food 92🏃 Movement 94🌿 Environment 90❤️ Health 99🚲 Bike share🐕 Dog park🏖️ Beach access🏥 Healthcare 80
Across food access, daily movement, environmental quality, and long-term health, this ZIP ranks among the top performers in all four areas. A combination found in fewer than 40 ZIPs nationwide. Arlington’s Rosslyn area pulls this off through Metro access and bike share that make active transit the default, plus just 18 estimated annual fast-food visits per resident. Negligible for a dense urban ZIP.
→All four sub-scores above 90. Happens in fewer than 40 ZIPs nationally
→18 estimated annual fast-food visits per resident. Effectively negligible for a dense urban area
→The defining edge: chronic disease and hospitalization rates here are measurably lower than the rest of Virginia
🥦 Food 88🏃 Movement 85🌿 Environment 53❤️ Health 98🌱 Community garden🐕 Dog park🏥 Healthcare 94
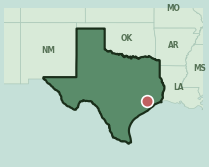
Houston’s Montrose ZIP walks at 16.5. Anomalous for a city whose urban design is more often cited as a cautionary tale than a pedestrian success story. That walkability shows up directly in some of the lowest chronic disease rates in Texas, despite air quality approaching the federal safety limit. Reflecting Houston’s genuine air quality challenge. Community gardens, dog parks, and easy daily movement options make 77098 function like a different city than its address would suggest.
→16.5 walkability in Houston. Contradicts most assumptions about the city’s walkability and street layout
→Physical inactivity rate of 13%. residents here are 57% more likely to stay active than the state average of 30%
→The defining edge: chronic disease and hospitalization rates here are measurably lower than the rest of Texas
🥦 Food 92🏃 Movement 82🌿 Environment 63❤️ Health 91🌱 Community garden🥾 Trail access🏥 Healthcare 72
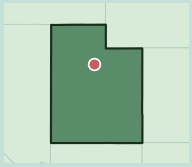
A farmers market within walking distance is rare at this population density. Orem’s 84097 has one, and it’s part of why food access stays strong in a mid-sized Utah city where national specialty chains don’t always follow. Trail access, 13.9 walkability, and solid options for staying active round out a ZIP where no single standout drives the results. Just consistent strength across food and movement working together.
→Farmers market access in a mid-sized Utah suburb. Uncommon at this population density
→92/100 food access without relying solely on major chain presence
→The defining edge: grocery density and healthy venue ratio both among the highest in Utah
🥦 Food 69🏃 Movement 64🌿 Environment 69❤️ Health 93🚲 Bike share🌱 Community garden🏥 Healthcare 91
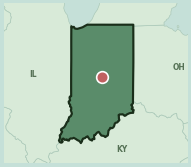
About 88% of nearby food venues are health-focused, even though overall food access here is just moderate. Carmel’s 46032 doesn’t have the raw density of a top-tier food market, but the options that exist skew hard toward wellness. A Meijer anchors the practical grocery side. Bike share, a community garden, and roughly two fast-food visits a month per resident all point the same direction as the area’s excellent health outcomes, among the best in Indiana.
→About 88% of nearby food venues are health-focused. Among the highest anywhere in the Midwest
→29 estimated annual corporate fast-food visits per resident. Well below the suburban Indiana average
→The defining edge: chronic disease and hospitalization rates here are measurably lower than the rest of Indiana
🥦 Food 85🏃 Movement 74🌿 Environment 66❤️ Health 86🌱 Community garden💪 High gym density🏥 Healthcare 74
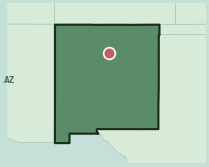
Santa Fe sits at altitude with air quality roughly 54% below the federal safety limit. Some of the cleanest in the Southwest, produced by elevation and low industrial density. A community garden and Whole Foods in a mid-sized western market at 12.9 walkability combine into food and activity options that punch above the city’s population size. Health outcomes here show notably low chronic disease rates. A result that’s hard to achieve in New Mexico.
→Air quality roughly 54% below the federal safety limit. Among the cleanest in the Southwest
→Whole Foods and community garden access in a mid-sized western city. Uncommon at this population density
→The defining edge: chronic disease and hospitalization rates here are measurably lower than the rest of New Mexico
🥦 Food 92🏃 Movement 82🌿 Environment 53❤️ Health 75🐕 Dog park💪 High gym density🏥 Healthcare 74
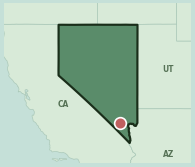
Las Vegas’ Summerlin leads the state with strong food options nearby and easy ways to stay active. And the air quality here surprises most people. Roughly 53% below the federal safety limit, cleaner than most US coastal cities, produced by valley air circulation that keeps particulates well below Nevada’s industrial interior. Health outcomes show where Vegas-area behavioral patterns register their weight on overall wellness.
→Air quality roughly 53% below the federal limit. Cleaner than most US coastal cities despite the Las Vegas address
→92/100 food access in a Las Vegas ZIP. Albertsons density and suburban grocery coverage doing measurable work
→The defining edge: grocery density and healthy venue ratio both among the highest in Nevada
🥦 Food 90🏃 Movement 77🌿 Environment 27❤️ Health 93🐕 Dog park🚲 Bike share🏥 Healthcare 62
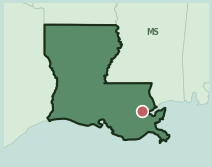
New Orleans’ Lakeview ZIP tells two true stories at once. The air here carries real petrochemical and industrial burden. Yet residents maintain some of the strongest health markers in Louisiana despite that pressure. The Fresh Market anchors the grocery scene, walkability sits at 14.7 (notably high by US standards), and healthy food options outnumber fast food outlets by more than 4 to 1, among the best ratios in the state.
→About 81% of nearby food venues prioritize health. One of the most favorable food landscapes in Louisiana
→Physical inactivity rate of 14%. residents here are 56% more likely to stay active than the state average of 33%
→The defining edge: chronic disease and hospitalization rates here are measurably lower than the rest of Louisiana
🥦 Food 97🏃 Movement 56🌿 Environment 62❤️ Health 96🏥 Healthcare 74
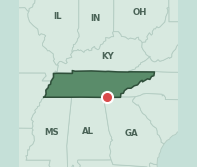
Lookout Mountain sits on a ridge above Chattanooga with 2,058 residents and the largest state gap on this list. Health outcomes read 96 where Tennessee’s median ZIP reads 18. Food access is 97 against a state median of 41. The environment score, 62, is the one measure where the rest of Tennessee does better.
→Health outcomes 96 against a Tennessee median of 18 — a 78-point gap, the largest on this list
→Food access 97 against a state median of 41
→Working against it: environment 62, below Tennessee’s median of 75
See why your ZIP code is worse than Lookout Mountain
🥦 Food 85🏃 Movement 41🌿 Environment 69❤️ Health 97🌱 Community garden💪 High gym density🏥 Healthcare 68
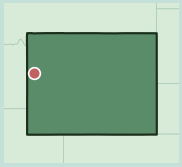
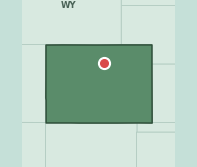
Jackson has some of the lowest chronic disease rates in Wyoming, which makes sense for a community built around outdoor recreation. The air here is roughly 56% below the federal safety limit. Among the cleanest in the Mountain West. The walkability and gym numbers don’t fully capture how active residents actually are in a place where hiking, skiing, and mountain biking are part of daily life. A Whole Foods and community garden bring fresh food options to a remote market that otherwise wouldn’t support either.
→Air quality roughly 56% below the federal safety limit. Exceptional even by Rocky Mountain standards
→Obesity rate of 24.2%. 10 percentage points below the 34% state average
→The defining edge: grocery density and healthy venue ratio both among the highest in Wyoming
🥦 Food 96🏃 Movement 74🌿 Environment 35❤️ Health 95🥾 Trail access⛵ Marina access🏥 Healthcare 87
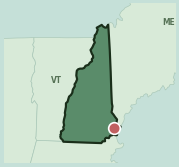
Market Basket has roughly 100 US locations and has been rated among the best-value grocery chains in the country by Consumer Reports for years running. New Hampshire’s 03885 runs Market Basket as its food backbone. Which is how strong food access holds in a rural coastal ZIP. Air quality roughly 50% below the federal limit is genuinely clean; the lower environment ranking reflects documented seacoast water quality concerns, not what’s in the air.
→96/100 food access built on Market Basket. Rated among the best-value grocery options in the US
→Air quality about 50% below the federal limit despite a low environment score. Water quality, not air, is what drags the number
→The defining edge: grocery density and healthy venue ratio both among the highest in New Hampshire
🥦 Food 46🏃 Movement 81🌿 Environment 96❤️ Health 80🏥 Healthcare 81
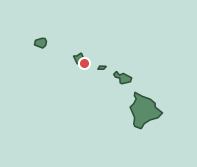
Honolulu’s urban core takes Hawaii on movement. Walkability scores 81 against a state median of 52 — the density that makes a city walkable is concentrated here and almost nowhere else in the islands. Environment reads 96, but so does the state median; clean air is Hawaii’s baseline, not this ZIP’s achievement. Food access, at 46, sits just under the state median.
→Walkability 81 against a Hawaii median of 52 — by a distance the most walkable ZIP in the state
→Environment 96, though that matches the state median exactly. Clean air here is the baseline, not the edge
→Working against it: food access 46, marginally below the state median of 51
🥦 Food 63🏃 Movement 35🌿 Environment 98❤️ Health 96🏥 Healthcare 48
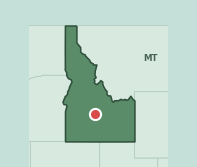
Ketchum is the trade-off made visible. Environment scores 98 and health outcomes 96, both near the ceiling — mountain air, and a population that uses it. But walkability lands at 35 and healthcare access at 48, each below the Idaho median. This is a place that earns its score outdoors and gives some of it back the moment you need a doctor or a sidewalk.
→Environment 98.5 and health outcomes 96 — both in the national top few percent
→Movement scores 35, below Idaho’s median of 50. A resort town built around cars and trailheads, not sidewalks
→Working against it: healthcare access 48, under the state median. The nearest full hospital is a drive, not a walk
🥦 Food 89🏃 Movement 89🌿 Environment 38❤️ Health 97🥾 Trail access🌱 Community garden🐕 Dog park🏥 Healthcare 88
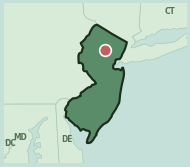
Wegmans in a ZIP code with some of the lowest chronic disease rates in the state is not a coincidence. New Jersey’s 07927 runs one of the country’s most-trusted specialty grocers in a market where food access and movement reach the same strong level. An unusual equilibrium. Trail access and 12.9 walkability push activity options above what the suburban footprint suggests; the environment score reflects New Jersey’s industrial air shed, not the food or health story.
→Wegmans as the food anchor. Consistently rated among the top US chains for quality and selection
→89/100 food access and 89/100 movement. Both sub-scores at nearly identical levels
→The defining edge: grocery density and healthy venue ratio both among the highest in New Jersey
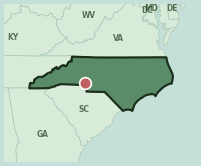
🥦 Food 93🏃 Movement 96🌿 Environment 58❤️ Health 97🌱 Community garden🐕 Dog park🏥 Healthcare 97
Charlotte’s Myers Park ZIP has the strongest movement profile in the Carolinas. Not what most people expect from a city often cited for car dependency. At 15.4 walkability, this neighborhood operates differently from its metro’s reputation. Some of the lowest chronic disease rates in the state and 78 estimated annual fast-food visits per resident confirm that easy everyday activity here is translating into measurable results.
→95.9/100 movement infrastructure. Highest in both North and South Carolina
→15.4 walkability in Charlotte. Contradicts how the city is usually described
→The defining edge: chronic disease and hospitalization rates here are measurably lower than the rest of North Carolina
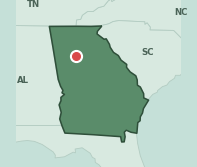
🥦 Food 72🏃 Movement 78🌿 Environment 58❤️ Health 97🏥 Healthcare 78
Decatur posts a health outcomes score of 97 in a state whose median ZIP sits at 43. That is the widest health gap on this entire list. Walkability and healthcare access both land in the high 70s, roughly double the Georgia median. Air quality is the one place it doesn’t lead — 58, just under the state’s own median.
→Health outcomes 97 against a Georgia median of 43 — the widest gap between a winner and its state anywhere on this list
→Walkability 78 and healthcare access 78, both close to double the state median of 43 and 50
→Working against it: environment 58, marginally below Georgia’s median of 62
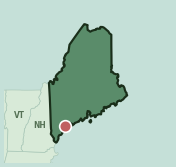
🥦 Food 96🏃 Movement 90🌿 Environment 88❤️ Health 76🌱 Community garden⛵ Marina access🏖️ Beach access🏥 Healthcare 94
Air quality roughly 50% below the federal safety limit, cleaner than most US metro areas, thanks to Atlantic coastal positioning and low industrial density in the region. Portland’s downtown ZIP builds on that with excellent food access, solid opportunities to stay active, and 5 healthy food options for every fast food outlet at 16.7 walkability, one of the more walkable neighborhoods in the country. This is a neighborhood where healthy choices layer on top of each other rather than compete.
→Air quality roughly 50% below the federal safety limit. Cleaner than most Northeast metro areas
→About 83% of food venues within reach prioritize health. And 16.7 walkability means most are accessible on foot
→The defining edge: clinic density and preventive care options above most of Maine
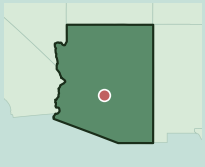
🥦 Food 87🏃 Movement 81🌿 Environment 52❤️ Health 97🥾 Trail access💪 High gym density🏥 Healthcare 91
Chronic disease rates in this Scottsdale ZIP are lower than almost anywhere else in Arizona, with some of the state’s lowest diabetes, obesity, and preventable hospitalization numbers. A Sprouts as the primary grocer, a trail within reach, a walkability score of 12.2 (above average for a US neighborhood), and air quality roughly 40% below the federal safety limit all combine into daily conditions where the healthy option is also the convenient one.
→Physical inactivity rate of 14%. residents here are 41% more likely to stay active than the state average of 25%
→Air quality roughly 40% below the federal safety limit. Cleaner than most of the Phoenix metro
→The defining edge: chronic disease and hospitalization rates here are measurably lower than the rest of Arizona
🥦 Food 96🏃 Movement 87🌿 Environment 7❤️ Health 99🏥 Healthcare 84
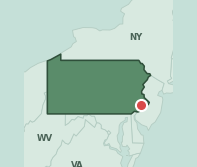
Chestnut Hill sits at the top of Philadelphia and at the top of Pennsylvania. Health outcomes read 99 against a state median of 50 — the widest health gap of any state winner on this list. Food access and healthcare access both clear 90. Its weak point is air: the Philadelphia basin holds what the hills above it cannot clear.
→Health outcomes 99 against a Pennsylvania median of 50
→Food access and healthcare access both above 90 — city infrastructure without city air
→Working against it: environment is the one dimension where much of rural Pennsylvania scores better
🥦 Food 89🏃 Movement 85🌿 Environment 88❤️ Health 89🌱 Community garden⛵ Marina access🐕 Dog park🏥 Healthcare 87
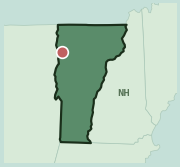
Burlington’s strengths in food, movement, environment, and health outcomes all land within a few points of each other. That kind of balance is harder to build than a single standout number. Air quality roughly 50% below the federal safety limit reflects genuine Lake Champlain basin conditions; Hannaford as the grocery anchor brings consistent local-sourcing quality that the region’s big-chain alternatives don’t match. A community garden and marina add the texture small-city wellness culture actually runs on.
→All four sub-scores within 4 points of each other. One of the most balanced profiles in the Northeast
→Air quality roughly 50% below the federal safety limit. Cleaner than most Northeast metro ZIPs
→The defining edge: grocery density and healthy venue ratio both among the highest in Vermont
🥦 Food 80🏃 Movement 83🌿 Environment 85❤️ Health 91🚲 Bike share🌱 Community garden🐕 Dog park🏥 Healthcare 92
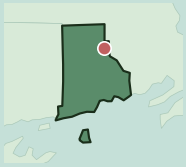
Providence’s College Hill ZIP has more modest food access than any other top performer in this list. And still posts some of the state’s lowest chronic disease rates. The gap gets explained by everything else working well: 15.9 walkability, solid options for staying active, and cleaner-than-average air and water. With healthy food options outnumbering fast food by about 3 to 1, the movement and environment strengths are carrying weight that food access isn’t fully pulling on its own.
→15.9 walkability and 83/100 movement compensating for a relatively lower 80/100 food access score
→85/100 environment score. The strongest single sub-score in this ZIP
→The defining edge: clinic density and preventive care options above most of Rhode Island
🥦 Food 27🏃 Movement 71🌿 Environment 66❤️ Health 90🏥 Healthcare 95
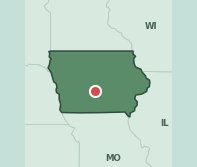
Downtown Des Moines wins Iowa on healthcare and walkability, not groceries. Healthcare access reads 95 against a state median of 52, and movement 71 against 35. Food access is the exception and it is a real one: 27, well under Iowa’s median of 48. A dense, walkable core with hospitals close and a genuinely thin grocery map.
→Healthcare access 95 against an Iowa median of 52, and walkability 71 against 35
→Health outcomes 90 — chronic disease rates well below the state’s
→Working against it: food access 27, below Iowa’s median of 48. The weakest grocery picture of any state winner on this list
🥦 Food 94🏃 Movement 79🌿 Environment 75❤️ Health 95🌱 Community garden🥾 Trail access🐕 Dog park🏥 Healthcare 78
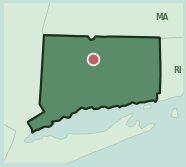
Five corporate fast-food visits per resident per year, the lowest estimated consumption of any high-performing ZIP in New England. It’s not accidental. With over 4 healthy food options for every fast food outlet, fast food is logistically inconvenient in West Hartford’s 06117. Excellent food access, a community garden, and air quality well below the federal safety limit create a ZIP where the healthy option is also the easy one.
→~5 estimated annual corporate fast-food visits per resident. Lowest in New England among high-scoring ZIPs
→About 81% of nearby food venues prioritize health. Fast food is outnumbered by more than 4 to 1
→The defining edge: grocery density and healthy venue ratio both among the highest in Connecticut
🥦 Food 92🏃 Movement 91🌿 Environment 22❤️ Health 91🌱 Community garden🐕 Dog park⛵ Marina access🏥 Healthcare 96
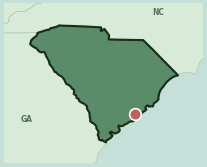
Environment: real air quality challenges. Food: strong. Movement: strong. Health outcomes: strong. Charleston’s downtown ZIP shows the South’s most striking split. Industrial coastal exposure dragging environment down while food, movement, and health all stay strong. Harris Teeter anchors the grocery side; at 16.8 walkability. The highest in South Carolina. The pedestrian-friendly streets are actively offsetting the environmental concerns.
→16.8 walkability. Highest in South Carolina
→22/100 environment score alongside 91–92 on three other sub-scores. Most dramatic split in the Southeast
→The defining edge: chronic disease and hospitalization rates here are measurably lower than the rest of South Carolina
🥦 Food 90🏃 Movement 73🌿 Environment 75❤️ Health 99🏖️ Beach access🐕 Dog park🌱 Community garden🏥 Healthcare 86
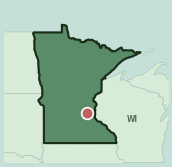
Nearly 5 healthy food options for every fast food outlet nearby, and some of the lowest chronic disease rates in the state. Minneapolis’ 55416 posts some of the most favorable food environment numbers in Minnesota, and the consumption data confirms it: 41 estimated annual corporate fast-food visits per resident is well below the urban Minnesota average. A beach and dog park add movement options that typical measures tend to undercount.
→Chronic disease rates. Diabetes, heart disease, preventable hospitalizations. Rank in the bottom 1% of all scored ZIPs nationally
→Nearly 83% of nearby food venues are health-focused. A ratio fewer than half of US states reach in their best ZIP
→The defining edge: grocery density and healthy venue ratio both among the highest in Minnesota
🥦 Food 86🏃 Movement 76🌿 Environment 60❤️ Health 99🏥 Healthcare 82
Boulder does what Colorado already does well, harder. Health outcomes read 99.4 in a state whose median is already a strong 90. Food access is 86 against a state median of 50. The surprise is air: environment scores 61, barely above the Colorado median — the Front Range traps what the mountains are supposed to clear.
→Health outcomes 99.4 — top 1% nationally, in a state that is already among the healthiest
→Food access 86 against a Colorado median of 50
→Working against it: environment 61, only just above the state median. Front Range air is the ceiling on this score
🥦 Food 92🏃 Movement 72🌿 Environment 75❤️ Health 95🚲 Bike share⛵ Marina access🏖️ Beach access🏥 Healthcare 89
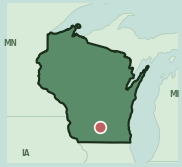
With nearly 5 healthy food options for every fast food outlet, Madison’s University District doesn’t just have good food options. The alternatives are structurally outnumbered. Chronic disease rates here are among the lowest in the state, and 45 estimated annual fast-food visits per resident reflect a food culture that acts on what’s available. Bike share and marina access at 14.5 walkability add ways to stay active that function through more than Wisconsin’s brief summer.
→About 82% of food venues in the ZIP lean toward health over convenience. Fast food is clearly the minority
→45 estimated annual fast-food visits per resident. Reflects a food culture that uses the healthy options
→The defining edge: grocery density and healthy venue ratio both among the highest in Wisconsin
🥦 Food 94🏃 Movement 90🌿 Environment 80❤️ Health 99🚲 Bike share🐕 Dog park🌱 Community garden🏥 Healthcare 85
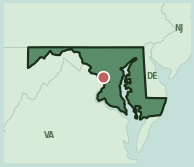
Residents here average roughly one fast-food visit every three weeks. A Trader Joe’s serves as the everyday grocery stop, the streets are walkable, and bike share is available. The neighborhood is set up for healthy living, and residents here have some of the lowest chronic disease rates in Maryland to show for it.
→18 estimated annual fast-food visits per resident. One of the lowest counts in the Mid-Atlantic
→Chronic disease and preventable hospitalization rates place this ZIP among the top 2% nationally
→The defining edge: grocery density and healthy venue ratio both among the highest in Maryland
🥦 Food 96🏃 Movement 78🌿 Environment 88❤️ Health 97🌱 Community garden🏖️ Beach access🐕 Dog park🏥 Healthcare 89
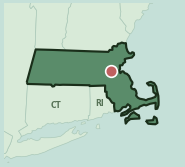
For every fast-food or convenience outlet in Newton’s 02464, there are five and a half health-supporting alternatives. That 5.5:1 ratio is one of the most favorable food landscapes in New England, built on excellent grocery and fresh food options, a community garden, and beach access within the ZIP. Air quality sits well below the federal safety limit, and a walkability score of 17.5 places this among the most walkable neighborhoods in the country. That combination shows up clearly in some of the lowest chronic disease rates in the state.
→About 85% of nearby food venues prioritize health over fast food. One of the most favorable food landscapes in New England
→17.5 walkability and air quality about 42% below the federal limit. Both above average for a dense suburban market
→The defining edge: grocery density and healthy venue ratio both among the highest in Massachusetts
See why your ZIP code is worse than Newton Upper Falls
🥦 Food 88🏃 Movement 87🌿 Environment 77❤️ Health 100🐕 Dog park🏖️ Beach access⛵ Marina access🏥 Healthcare 80
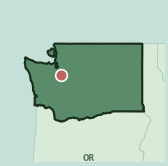
The highest raw walkability score of any ZIP in the full dataset: 19.1. Seattle’s South Lake Union and Belltown area earns that number through light rail, dense sidewalk networks, and a food environment where the grocery option outcompetes the drive-through on convenience. 10 estimated annual corporate fast-food visits per resident confirms it. Chronic disease rates here rank among the lowest in the state. Gym density runs 2.2× the national average.
→19.1 walkability. Highest of any ZIP in the dataset of 22,000+
→High blood pressure rate of 20% vs a 33% state average. A 14-point gap that reflects sustained healthy-lifestyle conditions
→The defining edge: grocery density and healthy venue ratio both among the highest in Washington
🥦 Food 86🏃 Movement 76🌿 Environment 96❤️ Health 97🏥 Healthcare 84
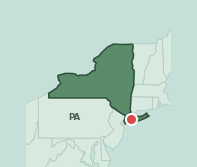
Long Island’s quiet middle. Plainview clears the New York state median on all five measures, which almost nothing does — food access 86 against a state median of 55, environment 96 against 66. Chronic disease and preventable hospitalization rates sit in the top 3% nationally. No single number carries this ZIP; it simply has no weak side.
→Beats the New York median on all five dimensions. Rare enough that only a handful of ZIPs in the state manage it
→Food access 86 against a state median of 55, in a state where grocery access swings wildly block to block
→The defining edge: health outcomes 97 — chronic disease rates here are among the lowest in the country
🥦 Food 93🏃 Movement 84🌿 Environment 75❤️ Health 90⛵ Marina access🏖️ Beach access🐕 Dog park🏥 Healthcare 91
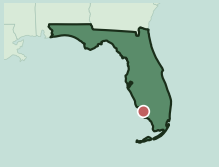
With air quality about 45% below the federal safety limit, Naples’ 34109 breathes cleaner than most of Florida. A product of Gulf Coast positioning that shields the ZIP from the inland air drift affecting much of the state. A marina and beach serve as the primary outdoor anchors, Sprouts provides specialty groceries, and excellent food access rounds out a lifestyle most Florida ZIPs can’t replicate through location alone.
→Air quality about 45% below the federal limit. Cleaner than roughly 80% of Florida’s scored ZIPs
→Marina and beach as primary outdoor anchors. Movement infrastructure built into the landscape
→The defining edge: chronic disease and hospitalization rates here are measurably lower than the rest of Florida
🥦 Food 95🏃 Movement 88🌿 Environment 94❤️ Health 99🚲 Bike share🌱 Community garden🐕 Dog park🏥 Healthcare 92
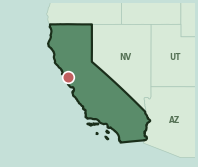
About one corporate fast-food visit every two weeks. The Castro doesn’t suppress fast food through rules. It outcompetes it through proximity. A Whole Foods, bike share, a community garden, a walkability score of 16.2 (one of the more walkable neighborhoods in the country), and notably clean air and water make the healthier option structurally easier than the drive-through.
→27 estimated corporate fast-food visits per resident per year. Among the lowest consumption profiles in California
→Physical inactivity rate of 12%. residents here are 51% more likely to stay active than the state average of 25%
→The defining edge: PM2.5 and water quality scores rank among the cleanest in California
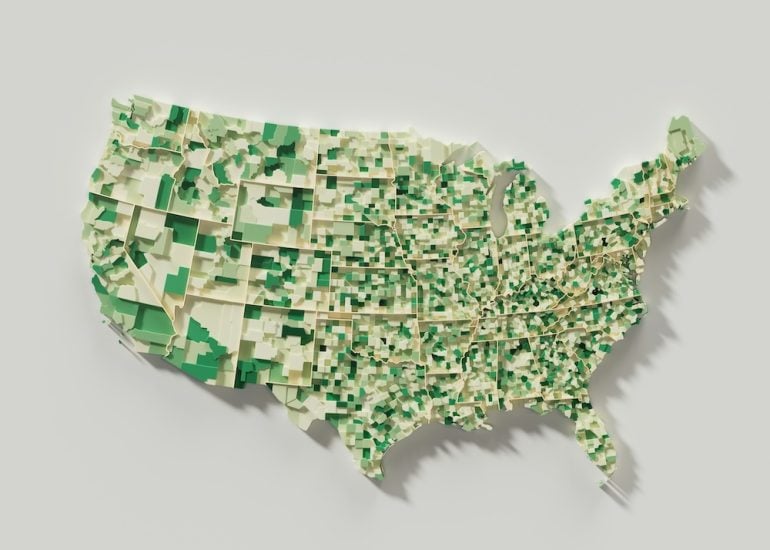
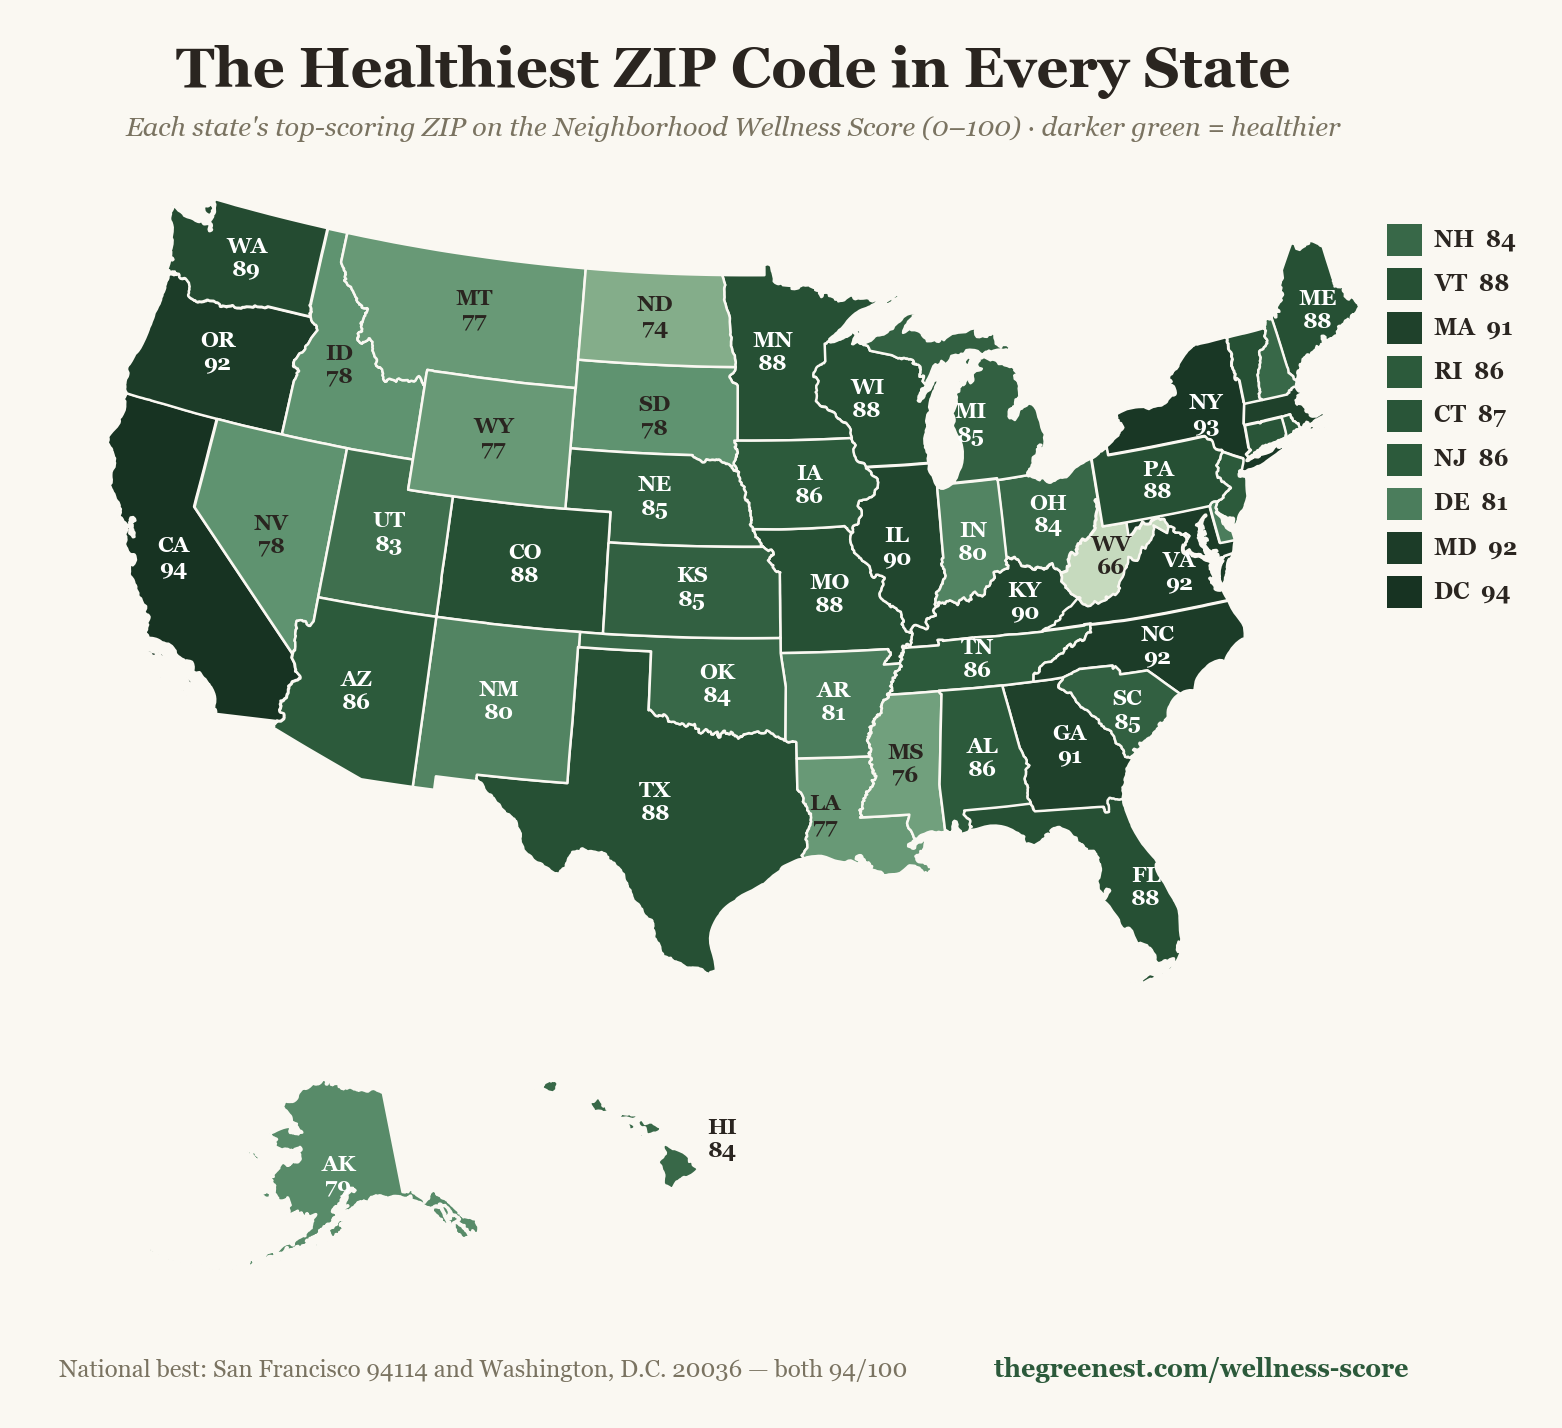
The 51 winners at a glance — every state’s best ZIP, colored by score. The full state-by-state breakdown follows.
Methodology
The Neighborhood Wellness Score combines five dimensions: Food Access (grocery density and proximity), Movement Infrastructure (parks, bike lanes, fitness facility density), Environmental Quality (air quality, pollution burden, protected land access), Health Outcomes (chronic disease rates, preventable hospitalizations), and Healthcare Access (FQHC presence, coverage rates). Data: CDC PLACES, EPA AQI, USDA Food Access Research Atlas, OpenStreetMap. Coverage: 18,356 U.S. ZIP codes. A small number of states had limited health outcomes data. Those ZIPs show “N/A” in the Health sub-score. Data period: 2024–2025.
Every ranking on this page comes from TheGreenest Wellness Score — a 0–100 measure of how supportive a neighborhood is of a healthy life, calculated for 18,356 residential ZIP codes nationwide. Each ZIP’s score blends five weighted sub-scores:
Health Outcomes (30%) — local rates of diabetes, obesity, depression, smoking and physical inactivity.
Food Access (25%) — distance to real grocers, food-desert status, and the density of fast food and dollar stores.
Healthcare Access (20%) — pharmacies, walk-in clinics and hospitals within reach.
Movement (15%) — gyms, fitness options and everyday walkability.
Environment (10%) — air quality and drinking-water contamination.
Each input is normalized across the residential ZIP universe and converted to a national percentile, then combined into the weighted composite. To keep the rankings meaningful, we exclude non-residential ZIPs — prisons, college campuses, military bases, and ZIPs with fewer than 1,000 residents — which otherwise distort the data.
Sources
Health outcomes: CDC PLACES (ZIP-level health measures).
Cory Jones has spent 20 years in media and publishing and now leads the data and editorial operation behind The Greenest. He built and maintains the site’s Neighborhood Wellness Score — a proprietary dataset scoring food access, walkability, air quality, healthcare access, and health outcomes across 18,356 U.S. ZIP codes, drawing on CDC PLACES data, EPA air quality readings, and verified location intelligence. He turned 50 last year, is a huge fan of Rancho Gordo beans, and tries to work out more than he actually works out.
The Greenest Wellness Score
Is your neighborhood healthy?
Get a free report on your tap water, air quality, walkability and more
Thanks! We’ve queued this article to your inbox. Check your email shortly.
Thanks! We’ve queued this article to your inbox. Check your email shortly.
Manage Consent
To provide the best experiences, we use technologies like cookies to store and/or access device information. Consenting to these technologies will allow us to process data such as browsing behavior or unique IDs on this site. Not consenting or withdrawing consent, may adversely affect certain features and functions.
Functional
Always active
The technical storage or access is strictly necessary for the legitimate purpose of enabling the use of a specific service explicitly requested by the subscriber or user, or for the sole purpose of carrying out the transmission of a communication over an electronic communications network.
Preferences
The technical storage or access is necessary for the legitimate purpose of storing preferences that are not requested by the subscriber or user.
Statistics
The technical storage or access that is used exclusively for statistical purposes.The technical storage or access that is used exclusively for anonymous statistical purposes. Without a subpoena, voluntary compliance on the part of your Internet Service Provider, or additional records from a third party, information stored or retrieved for this purpose alone cannot usually be used to identify you.
Marketing
The technical storage or access is required to create user profiles to send advertising, or to track the user on a website or across several websites for similar marketing purposes.