Skyline. Graeter’s. Kroger. Those are Cincinnati’s homegrown success stories. Cleveland will remind you it has its share, too: Mitchell’s, the West Side Market, and, well, a family diner on (what seems like) every corner. Which city, though, really is taking care of its own? We went looking for an answer.
Hamilton County and Cuyahoga County are home to thousands of restaurants, coffee shops, fast-food restaurants, grocery stores, gas-station markets, ice cream shops, bakeries and bars. We took a year of visits to the busiest of the bunch and sorted every place by who owns it. Before the rounds, here are the calls we made.
- Where we looked: all of Hamilton County and Cuyahoga County, city and suburbs together, because that’s where most people who call themselves Cincinnatians or Clevelanders live. The maps below show it.
- What counts as local: independent places, plus hometown chains: chains founded in that metro that are still based there. Both cities have them. Cincinnati has Skyline, Graeter’s, UDF, Frisch’s and Kroger. Cleveland has Marc’s, Dave’s Market, Heinen’s, Mitchell’s and truenorth.
- What doesn’t: chains from somewhere else, like Pittsburgh’s Giant Eagle in Cleveland or Michigan’s Biggby Coffee in Cincinnati. Kroger is the big judgment call. We count it as local, and the asterisk on the final score shows the result without it.
- How a round is won: the city that sends the bigger share of its visits to local places takes it. A gap under 2 points is a tie.
- If you don’t think a chain can ever be local: count only independent places and Cincinnati wins two rounds, groceries (6.7% to 2.7%) and dessert (11.0% to 0.0%), Cleveland wins bakeries (7.8% to 0.0%), and the other five are ties. Cincinnati’s edge comes from its hometown chains.
Why We Scored the Whole County
A lot of people who say they’re from Cincinnati or Cleveland live outside those cities’ boundaries, so we didn’t stop there. This is what we ended up with: the entire counties, with the actual cities shaded and the surrounding suburbs in gray.
Inside city limits Suburbs (rest of the county)
It matters. Count only places inside Cleveland’s city limits and 88 percent of restaurant visits go local, the best score in this whole contest. Take in the rest of Cuyahoga County and Cleveland’s share plummets to 30 percent, because most of the county’s busiest restaurants, and virtually all of its chains, are in the suburbs. Cincinnati drops too, from 64 percent inside its city limits to 27 percent countywide.
If the county is too big for you, the result holds closer in: within 10 or 12 miles of each downtown, the same city wins every round that isn’t a tie.
1. Restaurants
Winner: Cleveland (29.9%)
Runner-up: Cincinnati (27.4%)


Cleveland: It’s close, but Cleveland edges it out. Of the county’s 99 busiest restaurants, only 10 are actually within the city of Cleveland, and 64 of the 99 are chains. Applebee’s has 8 of them, and each of the two Cheesecake Factories, in Lyndhurst and Westlake, drew more visits than TownHall, the busiest local restaurant in the county. Cleveland’s advantage is a deep bench of hometown names, from TownHall and Cozumel to the Winking Lizard and Yours Truly. Inside the city limits, nearly nine of every 10 restaurant visits went local.
Cincinnati: With Skyline and Frisch’s counted as fast food, Cincinnati’s sit-down category includes 52 chains (out of the 79 busiest), including Buffalo Wild Wings (7 locations), LongHorn and Cracker Barrel. The most popular independent is Silver Spring House on East Kemper Road, followed by both Mi Cozumel locations and The Alcove by MadTree. (If you count Skyline and Frisch’s as sit-down, this category goes to Cincinnati 43.5% to 29.9%, and fast food becomes a tie. Cincinnati still wins either way.)
The busiest places on each county list, city and suburbs together, by visits in the year:
2. Fast Food
Winner: Cincinnati (8.4%)
Runner-up: Cleveland (1.4%)
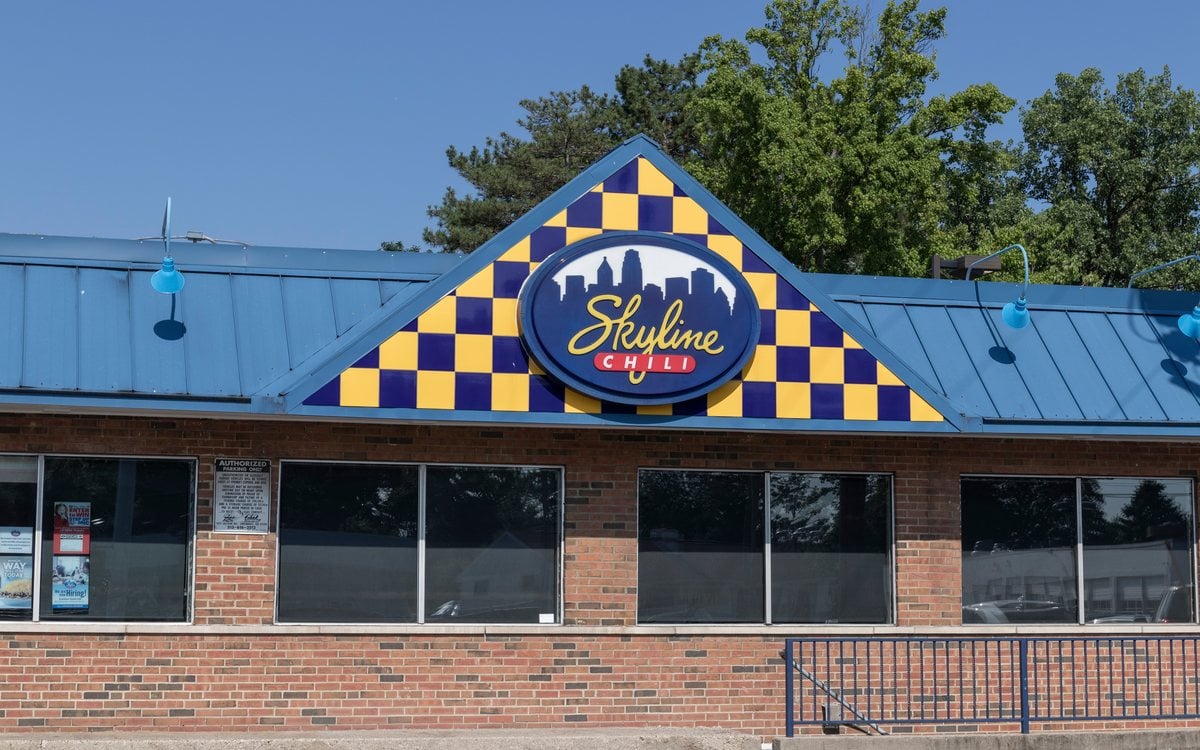

Cincinnati: Skyline is the story here: 10 of its parlors made Hamilton County’s top 100 and together drew 2.5 million fast-food visits. Frisch’s did well too, with two Frisch’s Big Boy locations making the list. In all, Cincinnati-based fast food chains accounted for just 8% of fast food visits in Hamilton County. McDonald’s took 46% across 35 restaurants. LaRosa’s did not have a single location make the top 100, even though its busiest store attracts approximately 180,000 visits per year, short of the roughly 215,000 it took to make the list.
Cleveland: Fast-food chain McDonald’s tops the list with 54 Cleveland-area restaurants that made Cuyahoga County’s list, accounting for 59% of fast-food visits. Mr Hero, Cleveland’s very own sub chain, doesn’t appear at all; its busiest shop logged only about 99,000 visits. The only local names on the list are two food halls, Van Aken Market Hall and Lakewood Truck Park.
The busiest places on each county list, city and suburbs together, by visits in the year:
3. Coffee
Too close to call: Cincinnati 2.7%, Cleveland 1.2%


Cincinnati: Coffee is a chain game in both counties. Starbucks and Dunkin’ rule coffee in Hamilton County with 82% of visits, while Michigan’s Biggby is the biggest other chain represented, with 9 locations. Only four of the county’s most-visited coffee shops are locally owned, Deeper Roots, Highland Coffee House, Luckman and Coffee Peddler, and together they account for less than 3% of visits.
Cleveland: Mojo’s in Bay Village is the only local business to make the list of the most visited coffee shops in Cuyahoga County. Starbucks and Dunkin’ took 87% of visits in Cuyahoga County, and 7 Brew took 9% of visits with its 3 drive-thru coffee shops. A gap this small is a tie.
The busiest places on each county list, city and suburbs together, by visits in the year:
4. Bakeries
Winner: Cleveland (7.8%)
Runner-up: Cincinnati (4.1%)


Cleveland: Panera Bread leads in both number of bakeries (12 Panera cafes in Cuyahoga County) and number of visits (66 percent of bakery trips go to Panera). But local bakeries Presti’s (Little Italy) and Michael Angelo’s (Broadview Heights) keep Cleveland ahead.
Cincinnati: National brands Panera, Crumbl, Paris Baguette and Nothing Bundt Cakes account for 70% of all bakery visits in Hamilton County, with Panera alone taking most of that. Servatii is the only local bakery on the list.
The busiest places on each county list, city and suburbs together, by visits in the year:
5. Ice Cream & Dessert
Winner: Cincinnati (80.6%)
Runner-up: Cleveland (57.4%)


Cincinnati: Graeter’s leads the pack with 10 locations on our list, with 1.5 million visits, 67% of all visits to ice cream & dessert shops in the county. Other Cincinnati area businesses that made the list include Zip Dip, Dairy Corner and Mt. Healthy Dairy Bar. Dairy Queen is the most popular chain.
Cleveland: Dairy Queen (38% of visits and 7 locations on the list) may be the biggest winner in Cleveland, but local Mitchell’s isn’t far behind (1.8 million visits across 7 locations), along with another Cleveland institution: Honey Hut.
The busiest places on each county list, city and suburbs together, by visits in the year:
6. Bars & Breweries
Too close to call: Cincinnati 96.1%, Cleveland 97.7%

Cincinnati: Hamilton County had just one chain (Tin Roof at The Banks) making its list of the top most visited bars. Overall, bars were the most local category in either county: roughly 24 of every 25 bar visits went to a local place. MadTree’s Oakley taproom was the most visited bar in either county with 361,121 visits.
Cleveland: The busiest here are Welcome to the Farm in the Flats and Great Lakes Brewing Company in Ohio City. The two counties land about a point and a half apart, which is too close to call.
The busiest places on each county list, city and suburbs together, by visits in the year:
7. Groceries
Winner: Cincinnati (81.2%)
Runner-up: Cleveland (38.9%)
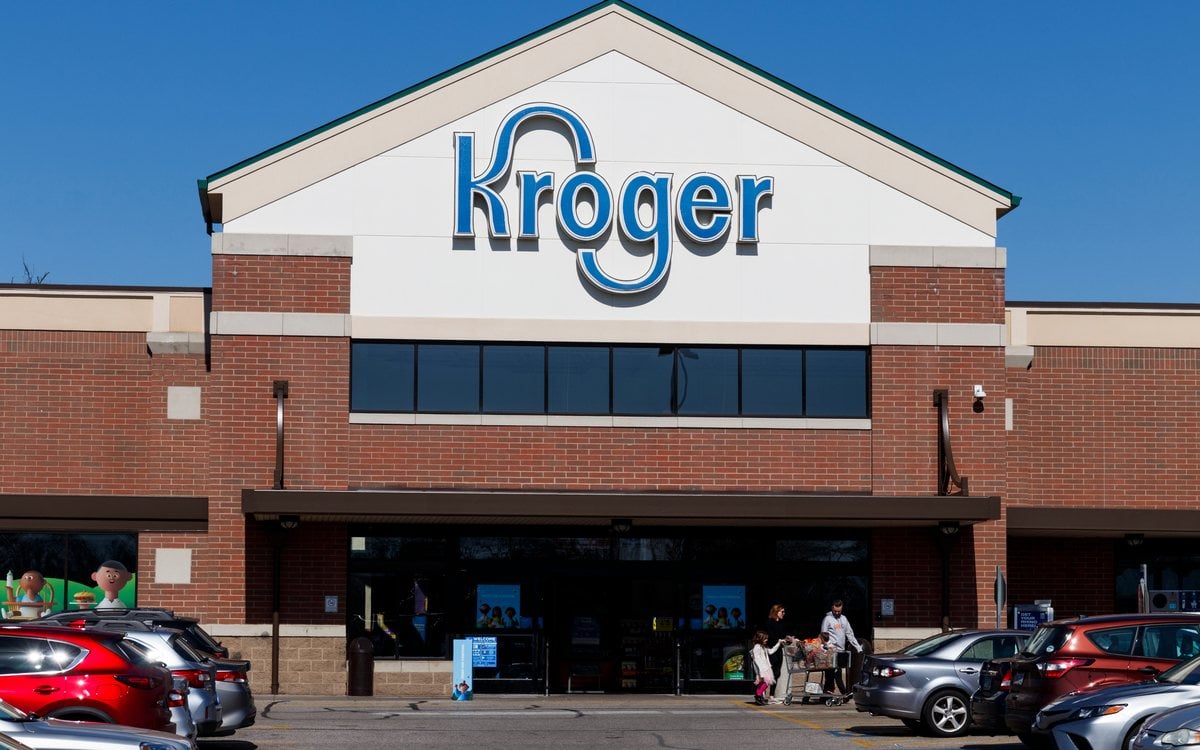

Cincinnati: Kroger, founded in Cincinnati and still based there, counts as local here, and it walked away with this one with 28 stores on Hamilton County’s list and 74% of grocery visits. Dillonvale IGA and Findlay Market count as local too.
Cleveland: Marc’s (21 stores), Dave’s Market (11) and Heinen’s (9) are all Cleveland-born, and between them Clevelanders made 35% of the county’s grocery visits at hometown chains. The biggest single name is still Giant Eagle, which is from Pittsburgh. Count Kroger as a national chain and this would be Cleveland’s round, 39% to 7%.
The busiest places on each county list, city and suburbs together, by visits in the year:
8. Gas-Station Markets
Winner: Cincinnati (47.3%)
Runner-up: Cleveland (21.9%)

Cincinnati: One name will likely stick out to many: UDF. United Dairy Farmers has 25 stores on the list and accounted for 43% of visits to the most shopped gas-station convenience markets in Hamilton County.
Cleveland: Cleveland’s hometown gas-station chain, Brecksville-based truenorth, took 17% of the county’s gas-station market visits. GetGo (owned by Pittsburgh’s Giant Eagle), Sheetz, Speedway and 7-Eleven took most of the rest.
The busiest places on each county list, city and suburbs together, by visits in the year:
The Verdict
Round by round, countywide and inside city limits:
| Round | Cincinnati | Cleveland | Winner |
|---|---|---|---|
| Restaurants | 27.4% | 29.9% | Cleveland City limits: Cleveland |
| Fast food | 8.4% | 1.4% | Cincinnati City limits: Cincinnati |
| Coffee | 2.7% | 1.2% | Tie City limits: Cincinnati |
| Bakeries | 4.1% | 7.8% | Cleveland City limits: Cleveland |
| Ice cream & dessert | 80.6% | 57.4% | Cincinnati City limits: Cincinnati |
| Bars | 96.1% | 97.7% | Tie City limits: Tie |
| Groceries | 81.2% | 38.9% | Cincinnati City limits: Cincinnati |
| Gas-station markets | 47.3% | 21.9% | Cincinnati City limits: Cincinnati |
And Cleveland’s independents rack up more restaurant visits than Cincinnati’s (its 100th-busiest indie restaurant sees roughly 62,000 visits a year; Cincinnati’s sees 37,000). It wins bakeries too. Where Cleveland can stumble, though, is in its suburbs: Clevelanders might defect to a Cheesecake Factory or an Applebee’s or even a Giant Eagle. Cincinnati’s local favorites, on the other hand, are chains it built itself: Skyline, Graeter’s, UDF and Kroger went wherever Cincinnatians went, even if that meant leaving the city.
Eleven More Head-to-Heads, for Bragging Rights
That’s the official score: Cincinnati 4, Cleveland 2. These face-offs don’t change it; they get their own tally, just for bragging rights.
9. Findlay Market vs. West Side Market
Bragging rights: Cleveland


West Side Market gets more visits (429,677) than Findlay Market (289,566). Saturday seems to be the biggest day at both markets: West Side Market (39% of visits) and Findlay Market (42% of visits). We can confirm that we’re looking at visits to the markets and not just the streets outside of them because visits to West Side Market on Tuesdays and Thursdays (days the market is closed) are almost zero and visits to Findlay Market on Mondays (day the market is closed) are almost zero.
10. Graeter’s vs. Mitchell’s
Bragging rights: Cleveland
Graeter’s had the highest number of locations listed, but overall Mitchell’s drew more visits (1.8 million, compared to Graeter’s 1.5 million), as well as more visits per location. Also, Mitchell’s fared better in the wintertime than Graeter’s: for Mitchell’s the most visited month (July) saw an average of 2.2 times as many visits as the least (January), while for Graeter’s the ratio was 2.7 to 1. The summeriest shop of all was Honey Hut on State Road, which saw 871 visits in January and 20,733 in June.
11. Skyline Chili vs. Mr Hero
Bragging rights: Cincinnati
Each city’s best-known hometown chain. Skylines average roughly 4.5 times the traffic of a Mr Hero. 10 Skylines made Hamilton County’s list of the busiest fast-food restaurants; not one Mr Hero made Cuyahoga County’s.
12. Kroger vs. Marc’s
Bragging rights: Cincinnati
In terms of number of visits, Cincinnati’s hometown grocer outdraws Cleveland’s, with the average Kroger store in Hamilton County receiving around 2.8 times as many visits as the average Marc’s in Cuyahoga County. So Cincinnati takes this one.
13. MadTree vs. Great Lakes
Bragging rights: Cincinnati
MadTree’s Oakley taproom was the busiest bar of any kind in either county, besting even Great Lakes Brewing Company’s brewpub in Ohio City. The Over-the-Rhine spot Rhinegeist was not far behind with 172,374 visits.
14. Servatii vs. Presti’s
Bragging rights: Cleveland
Presti’s Bakery in Little Italy drew about 2.5 times as many visits as the Servatii on Paxton Avenue, the only local bakery on Hamilton County’s list.
15. Izzy’s vs. Slyman’s
Bragging rights: Cleveland
Each city’s corned beef. Slyman’s Tavern in Independence drew 131,930 visits, about 2.1 times the 63,229 at the Izzy’s on Red Bank Expressway, the busiest Izzy’s we could measure. Slyman’s original on St. Clair Avenue and the downtown Izzy’s aren’t counted as single stores in our data.
16. Deeper Roots vs. Mojo’s
Bragging rights: Cleveland
Stripping out Dunkin’, Starbucks and other chains, here are the most popular coffee shops in each county. Mojo’s Coffee and More in Bay Village saw about 2.1 times as many visits as Deeper Roots Coffee. All told, the 15 independent coffee shops on Cuyahoga County’s list attracted 653,809 visits, while the 13 on Hamilton County’s list brought in 594,450.
17. Pizza Pub vs. Dina’s
Bragging rights: Cleveland
These are the busiest stand-alone pizza joints we measured. Pizza Pub, near the University of Cincinnati, sees its peak traffic at 11 p.m. Roughly 32% of Dina’s Pizza & Pub visits are less than 10 minutes long, probably folks picking up carryout. LaRosa’s, Cincinnati’s own pizza chain, is counted as a chain, so it isn’t on this list, but its Cheviot Road store drew 167,115 visits.
18. Frisch’s vs. Swensons
Bragging rights: Cincinnati
Swensons was founded in Akron, but it’s Cleveland’s now. The busiest Frisch’s in Hamilton County attracted 385,165 visits. The busiest Swensons in Cuyahoga County attracted 306,998 visits.
19. Sotto vs. LockKeepers
Bragging rights: Cincinnati
Sotto (164,543) edged out Jeff Ruby’s Precinct (149,749) and Carlo & Johnny (135,833) as the most-visited restaurants for a night out on the town. For special occasions, Cleveland’s LockKeepers took the top spot, followed closely by Pier W on the lake in Lakewood (89,419). Downtown Cleveland steakhouses like Marble Room are part of larger buildings, so they can’t be broken out individually in the data.
The Bragging Rights Go to Cleveland
What About Northern Kentucky?
The first question readers asked was about the river. Covington’s ZIP code 41011 sends more visits across the river than any other ZIP code in Kentucky, with ZIP codes in Northern Kentucky accounting for 15 percent of visits to destinations in Cincinnati. Ohio ZIP codes, in turn, account for a large share of visits to destinations in Northern Kentucky: 29 percent in Boone County, 34 percent in Kenton County and 42 percent in Campbell County. While they may not technically be in Cincinnati, many of the 405,000 residents of Campbell, Kenton and Boone counties refer to themselves as Cincinnatians, particularly if they live in Florence, Newport or Covington.
So we ran the three counties through the same eight rounds, pooled as one list per category and cut to the 100 busiest places, with the same rule for local: an independent business, or a chain that started in the Cincinnati metro, on either bank, and is still based there. Here is how Northern Kentucky scores next to the two counties in the main contest.
| SHARE OF VISITS THAT WENT LOCAL | N. KENTUCKY | HAMILTON | CUYAHOGA |
|---|---|---|---|
| Restaurants | 23.9% | 27.4% | 29.9% |
| Fast food | 9.3% | 8.4% | 1.4% |
| Coffee | 0.8% | 2.7% | 1.2% |
| Bakeries | 17.6% | 4.1% | 7.8% |
| Ice cream & dessert | 65.6% | 80.6% | 57.4% |
| Bars & breweries | 87.8% | 96.1% | 97.7% |
| Groceries | 74.7% | 81.2% | 38.9% |
| Gas-station markets | 35.9% | 47.3% | 21.9% |
Restaurants: Local restaurants in Northern Kentucky garnered 24 percent of restaurant visits, which lagged Hamilton and Cuyahoga by a few percentage points. Of Northern Kentucky’s 100 busiest restaurants, 66 were chains, with the top two being Texas Roadhouse (Florence and Fort Wright). The top three locally owned restaurants were Buckhead Mountain Grill (Bellevue), Hofbräuhaus Newport and Blind Squirrel (Florence), and the three Barleycorn’s locations combined for 462,766 visits. While Newport locally owned restaurants garnered a million visits (compared to just 374,000 in Covington, led by The Well and The Log Cabin), Covington wins the bar round (Covington Yard, Mainstrasse Village Pub, Olde Towne Tavern and Green House drew more local bar visits than any other town in the three counties).
Fast food: Hometown fast-food chains, including Skylines (seven), Frisch’s Big Boy (four), LaRosa’s (two), Gold Star, Wings & Rings and Tom + Chee, get 9 percent of fast-food visits, compared with 8 percent in Hamilton County. McDonald’s gets 36 percent of visits at its 20 area restaurants, compared with 46 percent in Hamilton County. The busiest fast-food restaurant in all three counties is Chick-fil-A in Fort Wright with 1,073,096 visits.
Coffee: Dunkin’ and Starbucks rule supreme in coffee with 72 percent of visits between them. Michigan-based Biggby Coffee does okay with 10 stores. The most visited coffee shop in Northern Kentucky is a 7 Brew in Newport with 659,286 visits. Coffee has the lowest percentage of local businesses of any category with less than 1 percent.
Bakeries: Emerson’s Bakery (Florence) and Servatii (Highland Heights) lead with 18 percent local bakery visits, compared to 4 and 8 percent respectively for Hamilton and Cuyahoga Counties. Still, three-quarters of all bakery visits go to Panera Bread.
Ice cream and dessert: Ice cream and dessert, all Graeter’s, made up 66 percent of trips in this category, with the chain’s four locations (Lakeside Park, Florence, Newport, Crestview Hills) drawing 65 percent of all dessert trips. No independently-owned ice cream shop in the three counties logged enough trips to be counted.
Bars: Eighty-eight percent of bar visits in Northern Kentucky went to locally owned places, in line with the 96 and 98 percent in the two Ohio counties. The biggest exception: the busiest bar in Northern Kentucky, Brothers Bar & Grill in Newport, is owned by a chain based in Wisconsin. Locally owned Dickmans in Fort Wright was the most visited local bar, and Longnecks racked up three total locations. New Riff Distilling in Newport saw 83,916 total visits.
Groceries: 75 percent of the trips made to grocery stores were made to locally owned grocery stores, with Kroger accounting for 70 percent of those trips. Kroger has 15 stores on the Northern Kentucky list, with the Newport Kroger accounting for 2.4 million trips. Remke, founded in Covington in 1897, has four stores on the list but no longer counts as local: it was bought by a company based in Findlay, Ohio, in 2017.
Gas-station markets: Thirty-six percent local. UDF has 14 stores and 23 percent of visits, roughly half the share it holds in Hamilton County, while Speedway takes 34 percent across 26 stores and the busiest single stop is the Thorntons in Edgewood. Although HOP Shops may seem like a Northern Kentucky brand, it’s owned by an Owensboro company, so its stores count as outsiders.
Two provisos apply. One, Kentucky’s lists trail off more gradually, because there aren’t so many highly-trafficked places, as the 100th most popular restaurant in Kentucky averages about 51,000 visits, versus 116,000 for Hamilton County’s. If we apply Hamilton County’s line, then Northern Kentucky’s homegrown restaurants take just 16 percent of restaurant visits, and fast food drops to 3 percent, because Kentucky’s homegrown businesses are smaller. Two, if we remove businesses born in Cincinnati and tally only the businesses Kentucky incubated, the local share plummets: for groceries it’s down to 5 percent, for gas station markets it’s down to 11 percent, and for fast food and dessert businesses it’s down to nothing. Kentucky eats local the same way Cincinnati does, by eating at Cincinnati’s local chains.
What if we added Boone, Kenton and Campbell counties to Cincinnati’s tally? Would that change the outcome? Nope. Pool them with Hamilton County and pare down each list to its busiest 100 businesses, and Cincinnati still takes 4 rounds, Cleveland 2, with 2 ties. Three categories change: bakeries now go to Cincinnati, bars to Cleveland (94 percent to 98) and fast food becomes a tie. Winner stays the same.
Is Kroger a local company? Should companies headquartered in Lakewood or Parma count as Cleveland companies, and should Boone, Kenton and Campbell be in Cincinnati’s main score rather than a section of their own? Let us know in the comments.
How We Measured This
Visits are based on aggregated and anonymized foot traffic data between Nov. 1, 2025 and Oct. 31, 2026. For each category we took the 100 busiest places in Hamilton County (Cincinnati) and Cuyahoga County (Cleveland). We sorted places by what they are, not only by the data’s labels: Skyline and Frisch’s Big Boy, because of their drive-thrus, count as fast food, while sit-down pubs like Silver Spring House and the Winking Lizard count as restaurants. That left 79 restaurants in Hamilton County, all above the same line of about 116,000 visits as Cuyahoga’s. Coffee, bakeries and ice cream come from one list of coffee, bakery and dessert shops, sorted by type; Dunkin’ counts as a coffee shop, and breakfast and smoothie places were left out. Local means an independent business, or a chain that started in that metro and is still headquartered there. Chains from other places don’t count: Giant Eagle and GetGo are Pittsburgh companies, so they aren’t local in Cleveland. Kroger counts as local in Cincinnati because it was founded there and is still based there; the asterisk on the final score shows the result without it. Scores within 2 points are a tie. For Northern Kentucky, we combined the results from Boone, Campbell and Kenton counties, thinned each list down to the 100 busiest locations and applied the same criteria; Remke and HOP Shops count as chains because their parent companies are based outside the region.
Shell and BP put their names on plenty of stations that are actually owned by somebody else, so we left fuel-brand-only names out of the analysis, along with places that aren’t quite restaurants or shops (dining halls on college campuses, wholesalers, a concert hall, a food bank). In the grocery round we left out beer and liquor stores. TownHall is located on a busy stretch of W. 25th Street in Ohio City, so we excluded its visits under 10 minutes (14 percent of the total), thinking many of those may have been people walking by. We used the same method to find the busiest places within each city’s limits. City and county boundaries come from the U.S. Census Bureau.

Cory Jones has spent 20 years in media and publishing and now leads the data and editorial operation behind The Greenest.
Is your neighborhood healthy?
Get a free report on your tap water, air quality, walkability and more